Executive Summary (Abstract)
Every company needs to understand its customers. In order to do this, how a customer interacts with a company must be defined, tracked, measured, and then optimized. We on the Cisco CX (CDI) team have developed the first iteration of tracking, measuring, and optimizing customer journeys for the DNAC product in a truely automated, scalable, intelligent, data driven way. This radical shift in thinking is to promote the idea that Cisco should have some way to understand each and every customer in a personalized way, so that we can identify and solve customer problems, simplify and enhance the way they interact with Cisco, and ultimately improve Cisco’s retention, brand, and direction as a company. Below, we outine the data that we use to track a customer throgh the lifecycle, the kinds of metrics we are currently generating, and the AI&ML models we have developed for optimizing and understanding the customer journey.
Track
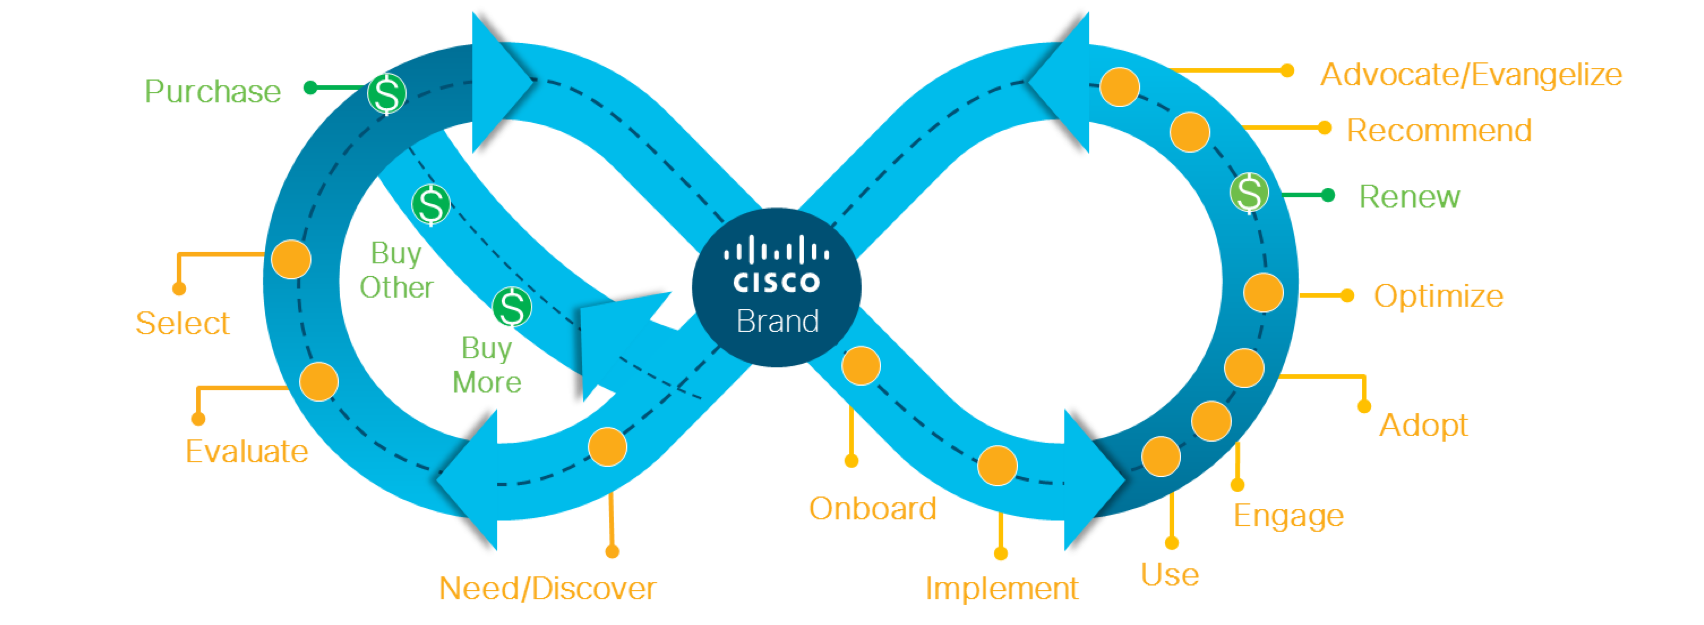
We have developed customer journey lifecycle stage definitions (Aka ‘Racetrack’) based on the data sources:
- Digital Behavior:
- Activity information gathered from web-pages, pathfactory content views, emails, etc…
- Purchase Behavior:
- Information about the products, services, etc… someone has purchased, previously purchased, purchased in groups, etc…
- Usage Behavior:
- Product usage data, hardware, software licences, appliance usage, UI management tool usage information, etc…
Measure
We have developed the following customer journey lifecycle stage metrics as a per-stage aggreagate level:
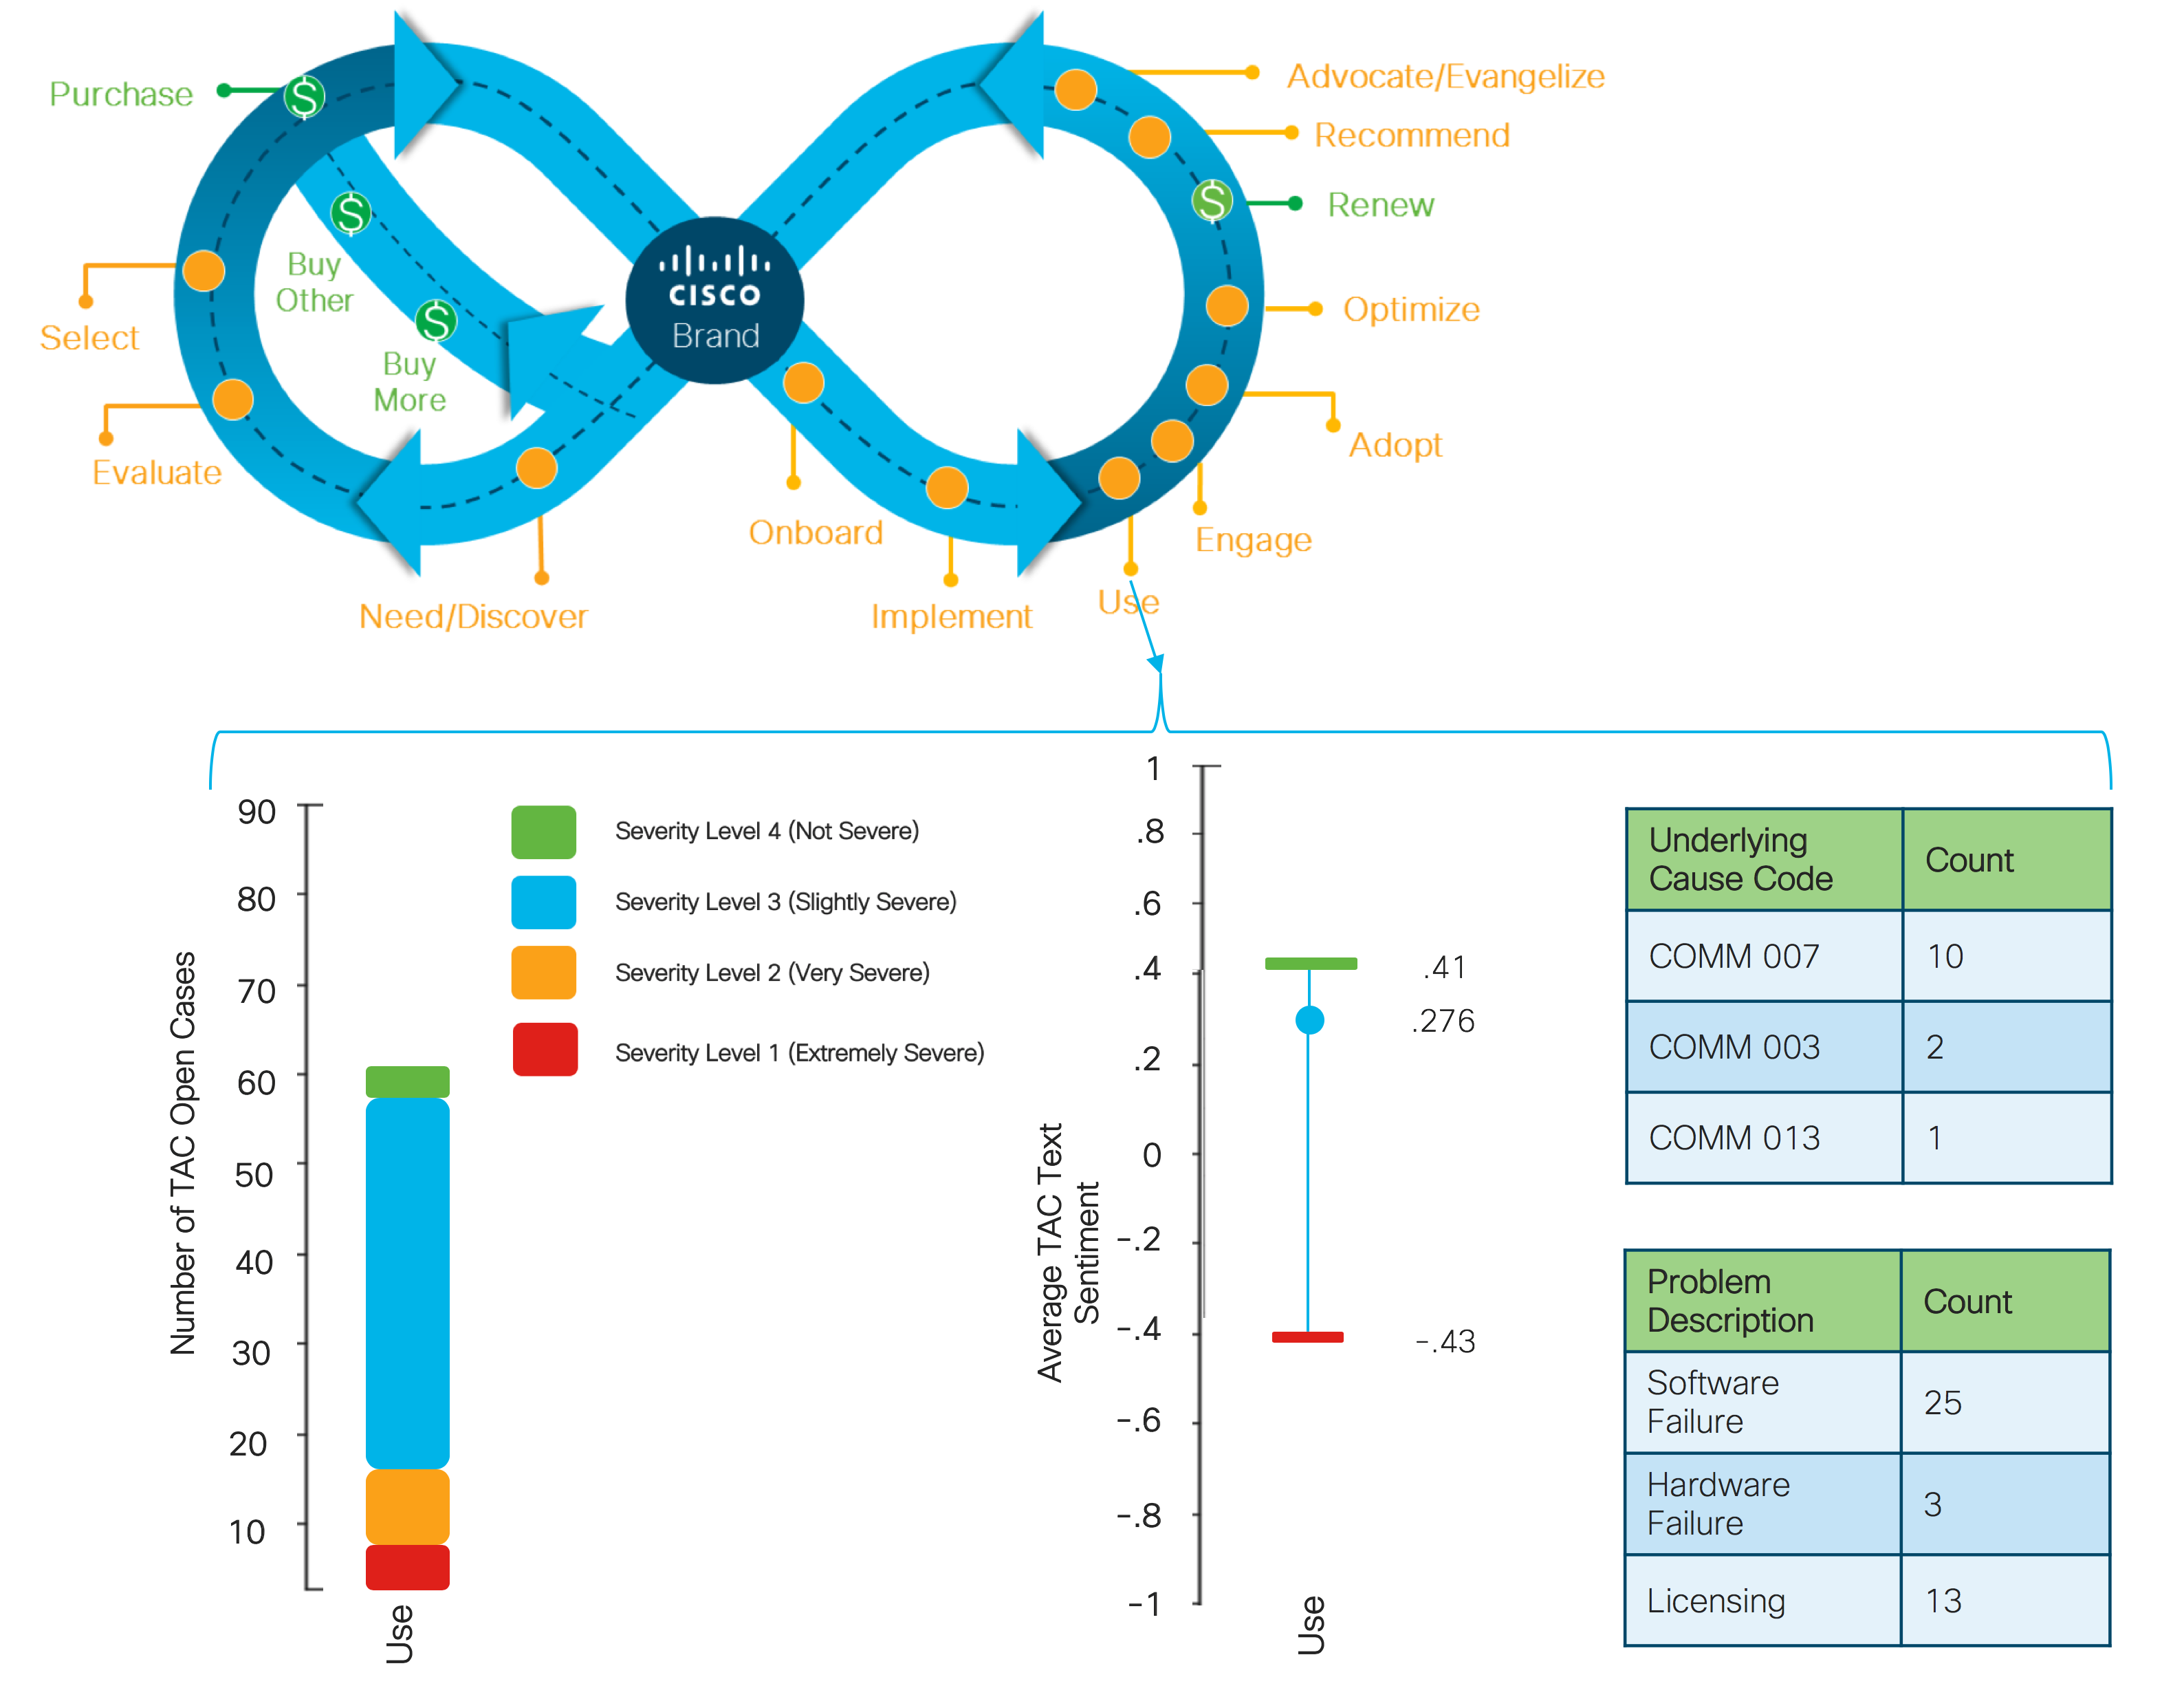
- Aggregate Per-Stage, Per-Day Metrics/Predictions (Eg, for the ‘Use’ stage: the average case severity is 3.5, the average survey score is 33, etc…):
- Open/Closed TAC Based Metrics (NLP Text Sentiment Breakdown, Case Severity Levels, Survey Scores, etc…)
Example Metrics Layout

Optimize
We have developed or are in the process of developing the following AI&ML predictive and prescriptive models for the customer journey lifecycle stage metrics:
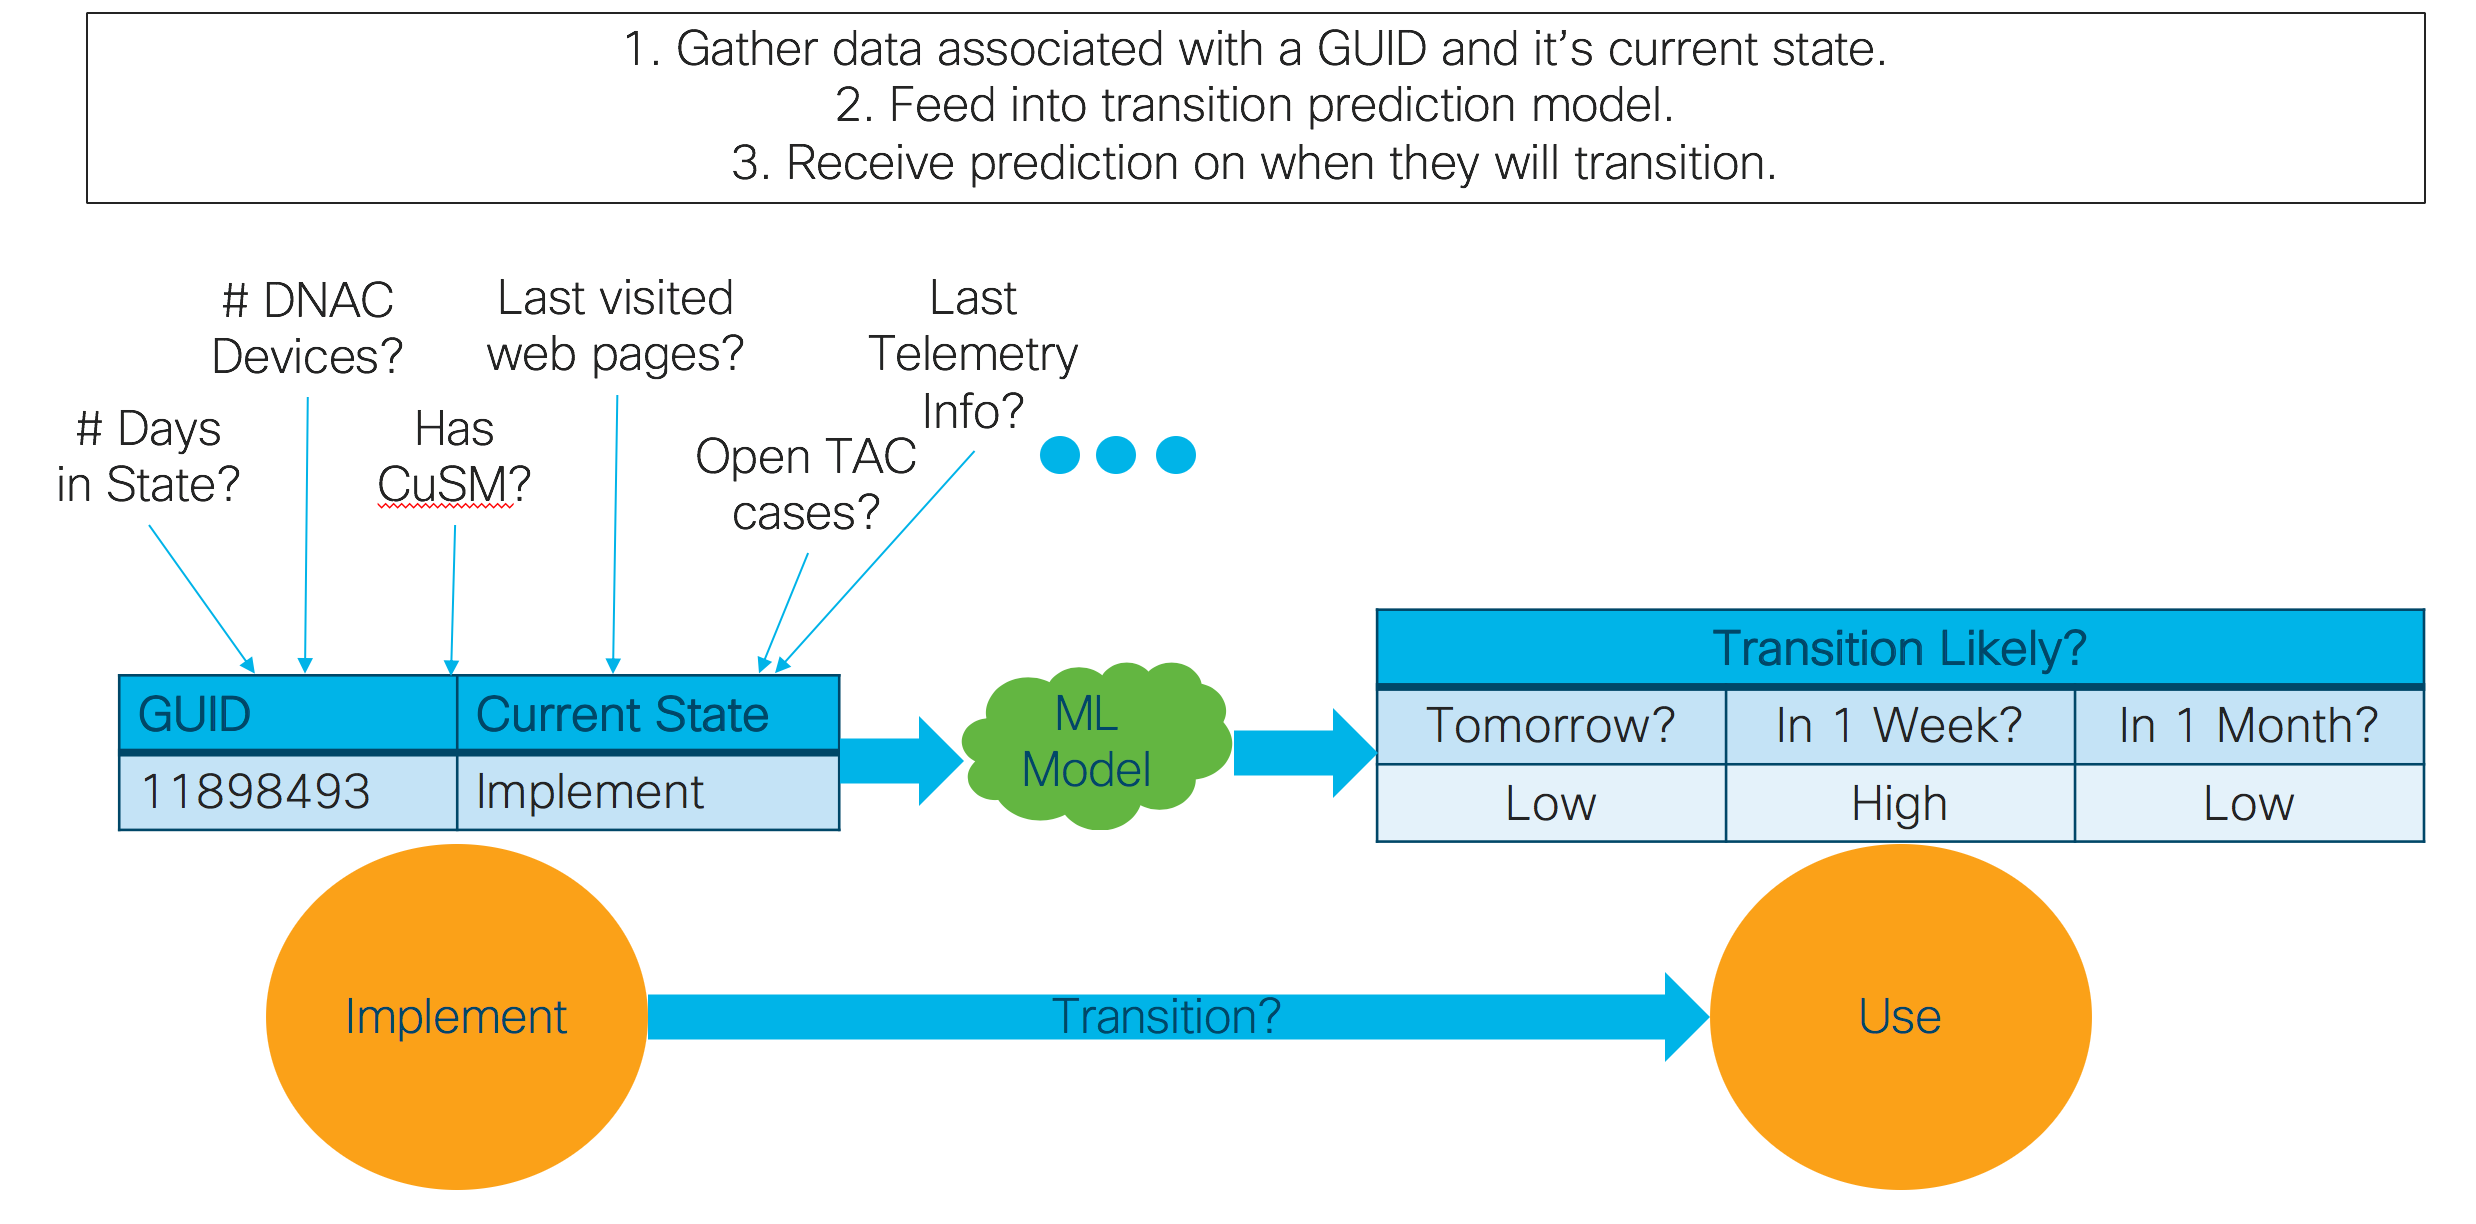
- GUID Per-Stage, Per-Day Metrics/Predictions (Eg, for the GUID ‘1198485’: the likely number of days until transition is 11, the likelihood of transitioning tomorrow is low, etc…):
- State transition based predictions (Likely number of days until GUID transitions to the next state, Likelihood of GUID transitioning to the next state in a day, Number of days a GUID was in a stage, etc…)
Example Model Predictions

We are always improving our pipeline, and envision all products and services having the same kind of system for tracking, measuring, and optimizing customer journeys. We constantly work to implement new methods for scalable, automated, and intelligent data driven insights so that we can deeply understand our customers, and profoundly change their perceptions of the Cisco customer experience.
Full Post
The Problem
What’s the Problem?
Every company needs to understand its customers. Period. There are no exceptions. Companies exist solely to provide the best products and services to customers. Companies need to understand their customers needs, problems, complaints, progress with using a product or service, etc…
Traditionally, companies have had issues in the following categories:
- Lack of visibility
- Companies typically only had visibilty into the customer lifecycle when they were actively purchasing a product, when they sent out simple surveys, and when customers returned to buy a new product or service. Yet, companies were typically blind to when customers were searching for products, when customers were setting up and using products, and when customers reached the point of trying to optimize the use of a product for their specific use case.
- Lack of personalized customer understanding
- With a large number of customers, it’s extremly hard to understand each of their particular needs. Learning about customer needs, documenting them, searching them, understanding them, and using them to provide value is almost impossible to do on a person by person basis.
- Lack of definition
- Since each customer is unique, how can you define each unique customer’s interaction with your company in a specific, general way?
With the rise of the digital age, these problems are greatly amplified. Yet, for digital selling channels and technology based products and services, an amazing opportunity is opened. Using automated pipelines to gather information about a customer’s activity, preferences, usage, etc… we can effectively solve the visibility and personalization problems. Using digitally gathered information, we can get an understanding of customer needs, problems, and behaviors at all stages of the customer lifecycle. Furthermore, we can build AI and Machine Learning based models to provide us predictive and prescriptive insights about how customers are likely to behave in the future, and how the components of the lifecycle might be changed to improve the customer journey.
Why Should Anyone Care?
Customers are the lifeblood of any business, and businesses need to have visibility into how a customer interacts with them. Furthermore, companies need to have a finger on the pulse of how customers are using their products and services, and their real business needs. The simple truth is that in the advent of the digital age, customers expect a deep understanding of their problems, tailored experiences, and simple, battle tested automation to guide them through the process of purchasing, managing, and using their products or services. This is fast becoming a basic expectation for all customers, large and small, across the entire business sector.
Digression, what is DNAC Again?
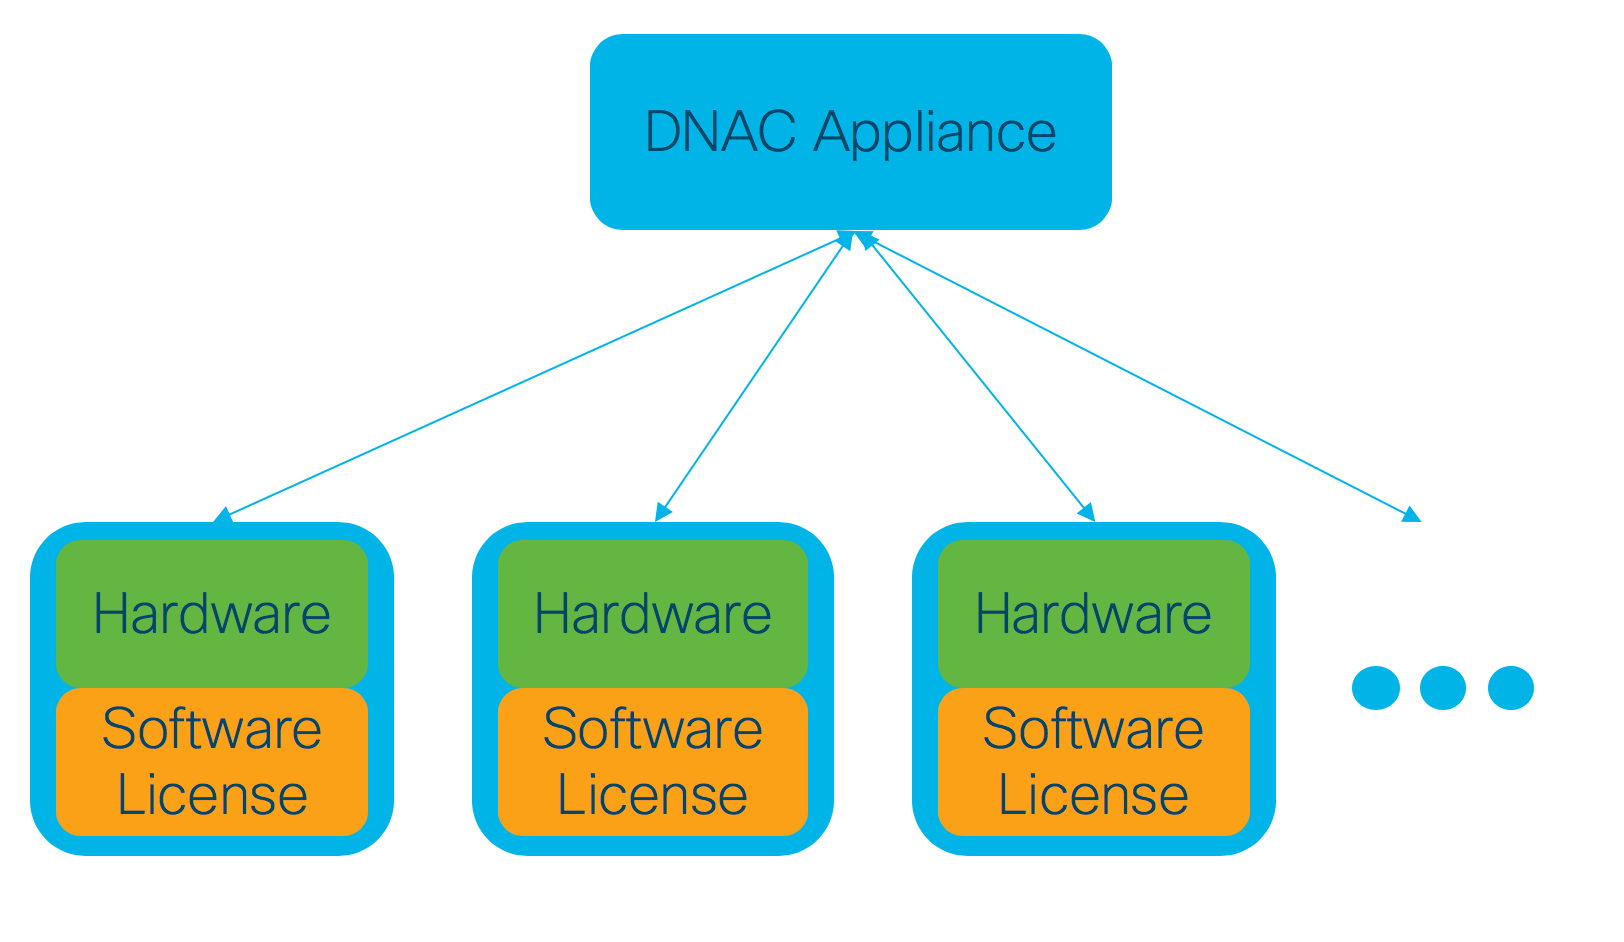
DNA is related to the product concept “Defined Network Architecture”. The goal of this product is to allow for ‘Intent Based Networking’. Let’s say you have a computer network that you have to manage. Let’s say this is a hospital’s network, where vital information is continually communicated across this network. So, having the network become unavailable for any amount of time is unacceptable. So, how can you configure your network so that it has a property called ‘high availability’ (meaning you can be pretty sure the network will continually operate, even if some devices on the network fail to be able to continue sending information). Well, if you had a DNAC appliance, the appliance could automatically configure your network to have this property. And that’s the idea. Given some quality my network should have (intent), I want my network to be automatically configured and managed to have that property. The main components for DNA then are the ‘DNAC’ appliance which manages and configures the network, the hardware devices that can be managed by the DNAC appliance (these might be say cat 9k switches), and the software license for each hardware device which allows it to be managed by the DNAC appliance. These roles are outlined in the diagram below. Thus, for the customer journey, it’s useful to know things like how many DNAC compatable hardware a customer has, or how many DNAC software license a customer has, or even how many DNAC appliances a customer has previously purchased.

The Solution
The Customer Lifecycle Definition.
So what is a customer lifecycle? Should it be defined on a per-product/per-service level? Maybe. But how do we make this scalable? Setting up custom data tracking pipelines for every product and every feature is just not practical from an engineering perspective. How can we make a tradeoff between customization and scalability? The answer is that a definition for the general lifecycle stages a customer can be in has to be defined. This definition has to be general enough to be useable for every product or service, while customizable enough to be tailored to each product or service. Thus enters the fondly named ‘racetrack’ defined by Maria Martinez (Head of the CX org at Cisco), which provides a general framework for thinking about the customer lifecycle. Our job was to take this general definition, and implement it in such a way that a single engineering methodology can be applied across all products. We used the DNAC product as a test bed for the first iteration of an automated pipeline modeled after the racetrack to track, measure, and optimize the customer journey. The details of how specifically we did this are given in the following sections.

The Datascience Solution.
Track. Measure. Optimize. Our data science projects revolve around these three stages. The ultimate goal for any data science project is to develop an automated pipeline that will either automatically improve a process, or will suggest changes to make that will improve a process (or some metric like customer retention). However, many data science projects fail because there is a disconnect between project goals and project requirements. Everyone wants to get to the optimize stage, not realizing that the track and measure stages must come first. The team executing on the automated customer journey lifecycle pipeline has members of our Data Engineering team (to focus on the track stage), our Data Analytics team (to focus on the measure stage), and our Data Science team (to focus on the optimize stage). The general stage definitions are:
- Track
- Set up the automated jobs for gathering data, connecting data together, transforming data, and making the resulting data available. Humans should not be manually performing these tasks because it’s not scalable. It also locks data from others who could find the data useful (aka an excel spreadsheet on a personal laptop is not accessible to others). Finally, automated processes can ensure that updated data is being gathered regularly. The idea is to set up the pipeline so that it effectively runs itself.
- Measure
- Set up the automated jobs for generating metrics about the process. For customer journeys, this might be things like average number of days a customer spends in a state, average churn rate for a stage, average sentiment for a state, aggregated web pages visited for a state, etc… These metrics provide insight to business stakeholders, and allow for AI&ML methods to be developed for optimizing processes and decision making.
- Optimize
- Set up the automated jobs for generating predictions and prescriptive actions about the process. For customer journeys, this might be models that try to predict the metrics that were previously developed in the measure stage, such as the predicted churn rate tomorrow, in a week, or in a month. It might also be models that provide prescriptive actions such as ‘If you could lower the # of days spent in the stage from 10 to 5, and directed customers to web pages ‘x, y, z’, then their likelihood of moving to the next stage would greately increase’.
The Customer Lifecycle Pipeline.
Track
We have developed an automated pipeline for gathering digital behavior, purchase behavior, and usage behavior information at the GUID and PartyID level. We have packaged together this information to various degrees to come up with ‘confidence/coverage’ levels. We have exact definitions for every stage, with little ambiguity. We have documented database, database source, data attributes, and exact rules used for defining the criteria for a customer to move into a stage. This allowed us to develop an automated pipeline with full visibility and traceability about why a customer was moved into a stage.
We have developed customer journey lifecycle stage definitions (Aka ‘Racetrack’) based on the data sources:
- Digital Behavior:
- Cicso.com web page interactions (Pages visited, clicks, etc…)
- PathFactory Interactions (Digital Content Interactions)
- myCisco Experience Interactions (ACC + ATX)
- Eloqua Interactions (Email opens, link clicks, etc…)
- Purchase Behavior:
- Install-base data (Aka what products, services, etc… someone has purchased, shipped, etc…)
- Usage Behavior:
- Telemetry data (DNAC Device usage data, hardware, sofwtare, appliance, etc…)
Measure
We have developed an initial set of automated scripts for generating metrics on a per-day granularity for the DNAC racetrack. The basic principle is to use customer ids from various data sources to map data to racetrack stages. For example, we use GUIDs associated with a TAC case to map it to a GUID of a customer in the racetrack. This allows us to show what TAC cases are open for what stages in the racetrack. The same principle can be applied with any kind of data that can be lined to a GUID or a PartyID.
We have developed the following customer journey lifecycle stage metrics as a per-stage aggreagate level:
- Aggregate Per-Stage, Per-Day Metrics/Predictions:
- Open TAC Based Metrics:
- Open # TAC Cases
- Open NLP TAC Case Text Sentiment (Average sentiment, proportion negative, positive, neutral)
- Open Incident Severity Counts (0 through 4)
- Open Underlying Cause Code Counts (Eg. COMM 007, COMM 003, etc…)
- Open Problem Description Counts (Eg. Licensing, SW Failure, Product Feature/Function Question, etc…)
- Closed TAC Based Metrics:
- Closed # TAC Cases
- Closed NLP TAC Case Text Sentiment (Average sentiment, proportion negative, positive, neutral)
- Closed Incident Severity Counts (0 through 4)
- Closed Underlying Cause Code Counts (Eg. COMM 007, COMM 003, etc…)
- Closed Problem Description Counts (Eg. Licensing, SW Failure, Product Feature/Function Question, etc…)
- Closed TAC Survey Average Score
- Closed TAC Survey Counts
- Open TAC Based Metrics:
Example Metrics Layout

Optimize
We have developed so initial Machine Learning based models around predicting the liklihood of a customer moving to the next state from their current state. We are also putting an emphasis on Machine Learning models that can tell us why someone is likely or unlikely to move. For example, are they likely to move because of the content they’ve viewed? Is a customer unlikely to move because of the amount of time they’ve spent in a stage. Being able to answer these questions allows us to start thinking about actions to remedy customers that have stagnated in their customer journeys. We can start to think of how we might reach out to a customer to help them continue their journey (aka, send an email out suggesting next steps, asking what the issue is). We can also start to develop continuous learning systems that can continually learn what works best over time (What content combinations should be used? When should someone be reached out to? Are there different combinations of content and timing that should be used based on the cusotmer’s profile?). Our team also has an AI driven experimentation framework initiative in the works that will help augment this process.
We have developed or are in the process of developing the following AI&ML predictive and prescriptive models for the customer journey lifecycle stage metrics:
- GUID Per-Stage, Per-Day Metrics/Predictions:
- Number of days a GUID was in a stage
- Likelihood of GUID transitioning to the next state in a day
- Likelihood of GUID transitioning to the next state in a week
- Likelihood of GUID transitioning to the next state in a day in a month
- Likely number of days until GUID transitions to the next state
Example Model Predictions

Our Plan for the Future.
Track
We used the philosophy ‘ a partial plan executed now is better than a perfect plan executed later’ when developing racetrack definitions. It’s better to develop a baseline definition and then iterate on that moving forward. Right now, we have a set of definitions with estimated ‘confidince/converage’ for the data sources we are using for our definitions. Moving forward, we are working on solidifying the tecnical data definitions for lifecycle stages, aligning them with multiple business stakeholders, and gathering new information to use in defning customer behavior.
Measure
Given that there is now a definition of the ‘racetrack’, which has a customer identifier, the state they are in, and what day the first moved into that state, any data that can be mapped to the customer identifier can be used. TAC cases and survey information are currently mapped to guids in the racetrack, but digital racetrack information, install-base information, telemetry information, sfdc data, etc… can all be mapped on top of this racetrack. The opportunies are truely boundless. Furthermore, since this has been developed as a data foundation, any team seeking to use the racetrack data or metrics can be used.
Optimize
We’ve been working on developing predictive models for suggesting how long a customer will stay in a stage, as well as what factors were most relevant to that prediction. We are working towards predictions around more specific usage metrics (TAC case severity predictions), as well as possible business related metrics on a per-stage level. We are also working on models that will provide presctiptive suggestions for modifying the customer journey (Including the incorporation of how we reach out to customers, what content we use, and when in an automated, continually improving way).
Epilogue: Dirty, Fragmented Data Challenges
Data Challenges
Developing automated, intelligent data pipelines is hard! Data is dirty and typically doesn’t match up as expected, data is fragmented across cisco, data found in the data lake typically doesn’t have any documentation attached making it difficult to understand what the data means, how data should be combined is typically unknown, and multiple business units have their own definitions of what a business objective means quantitatively. Here are some of the problems we frequently encountered during our journey:
- Dirty Data: Unique Ids frequently don’t match, or match only partially. Different organizations also soemtimes use different kinds of ids, which makes it challenging to connect data together.
- Lack of Data Documentation: Data schemas typically aren’t documented in a conviniently accessible method. We usually have to traverse the chain of contacts until we finally reach the person who typically wrote the code to generate the data.
- Data Access Challenges: Limited access to data, or not knowing where desired information is stored is frequently a challenge.